Explore the Newport DEM
We now have a finished coastal DEM for Newport, Oregon.
The key question in this module is:
What source data support different areas of the DEM?
We will answer that by viewing the hillshade together with the spatial metadata in a desktop GIS such as QGIS or ArcGIS Pro.
1. Get the Newport files into your GIS
First, confirm that the files are available:
ls -lh \
  ~/workshop/newport_dem/newport_n44x64_w124x10_hs.tif \
  ~/workshop/newport_dem/newport_n44x64_w124x10_sm.gpkg
If you are using QGIS, also use the prepared style file:
newport_n44x64_w124x10_sm.qmlDownload the files from JupyterLab
In the JupyterLab file browser:
Open
workshopfolder on the left side, thennewport_dem.Right-click each file.
Select Download.
Download:
newport_n44x64_w124x10_hs.tif
newport_n44x64_w124x10_sm.gpkg
For QGIS, also download:
newport_n44x64_w124x10_sm.qmlKeep the .gpkg and .qml files together.
If your Newport build did not finish
If the Newport build is still running, first stop it with Ctrl+C.
Known-good Newport files are available in:
~/workshop/reference_outputs/newport/Copy them into the Newport output directory:
mkdir -p ~/workshop/newport_dem
cp -a ~/workshop/reference_outputs/newport/. ~/workshop/newport_dem/
Then download the files from JupyterLab.
2. Look at the finished surface
Open the Newport hillshade in your GIS:
newport_n44x64_w124x10_hs.tif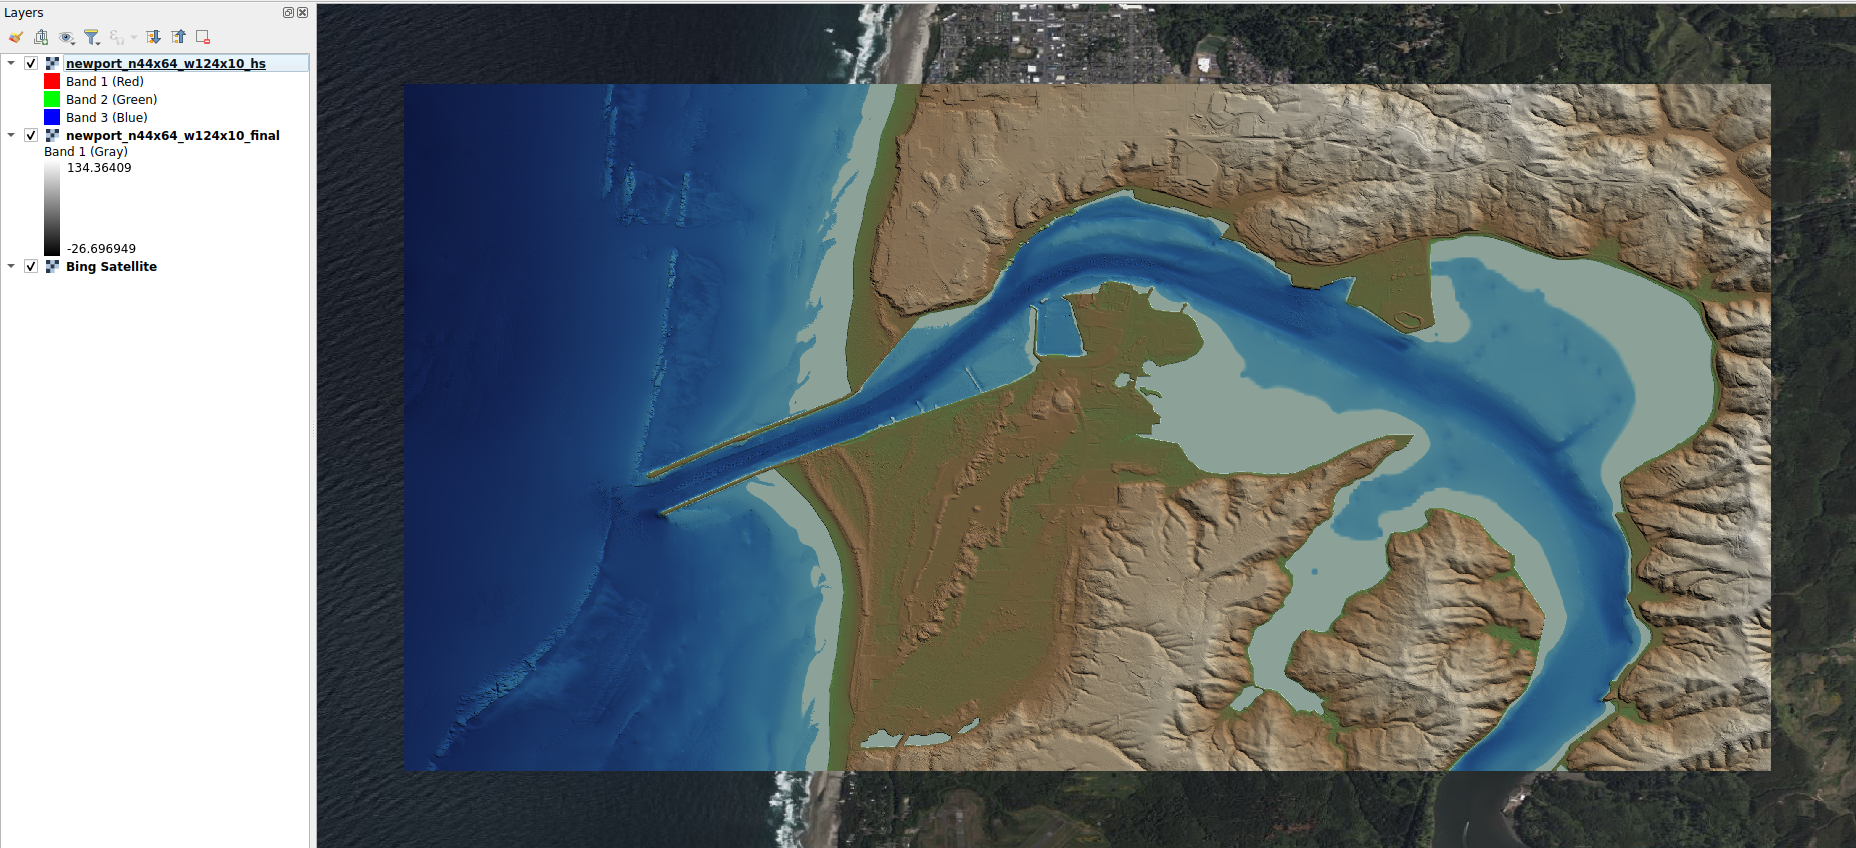
Newport coastal DEM hillshade. The hillshade reveals the shape and texture of the finished elevation surface around Yaquina Bay.
Look for:
Yaquina Bay
the entrance channel
the coastline
adjacent terrestrial terrain
nearshore bathymetry
transitions between detailed and smoother areas
3. Add the spatial metadata
The hillshade shows the finished surface.
The spatial metadata shows the source-data support behind that surface.
Add:
newport_n44x64_w124x10_sm.gpkgto your GIS and display it on top of the Newport hillshade.
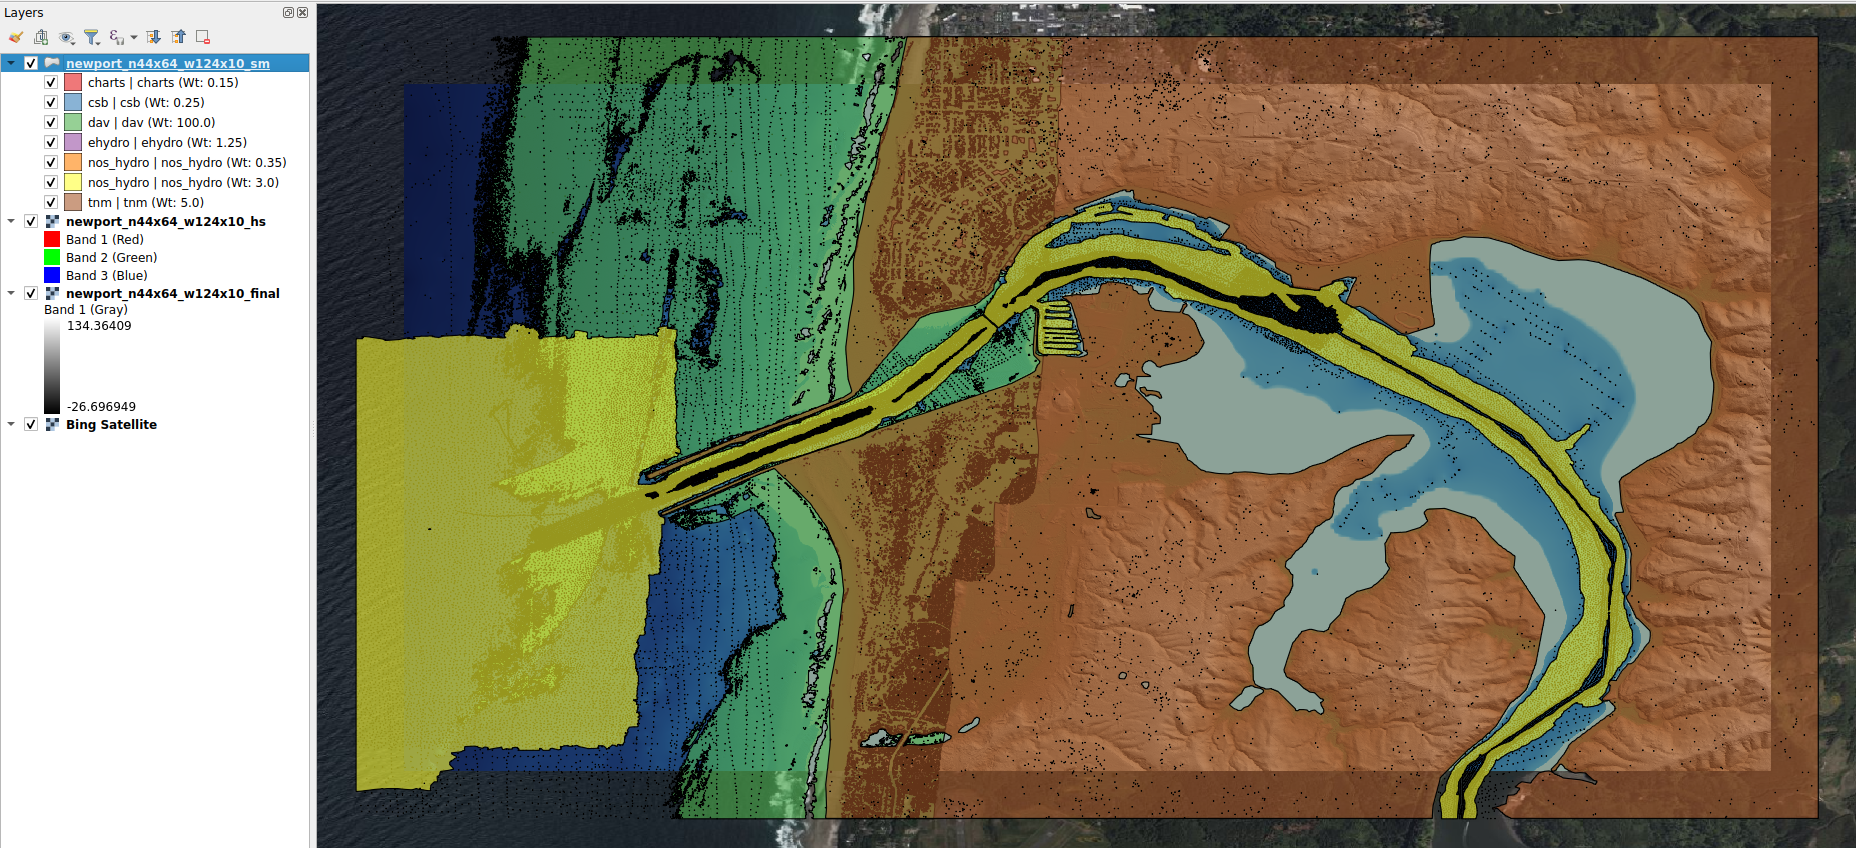
Newport hillshade with spatial metadata. The overlay connects places in the finished DEM with the source elevation data used to build it.
4. Trace one location back to its source
Return to the location you selected.
Using the hillshade and spatial metadata together, ask:
Which source dataset supports this location?
Is direct source-data coverage dense, sparse, or absent nearby?
Where might interpolation therefore play a larger role?
Inspect the spatial-metadata attributes
The GeoPackage includes attributes that provide additional information about the mapped source-data features, including the source module and relative weight or priority.
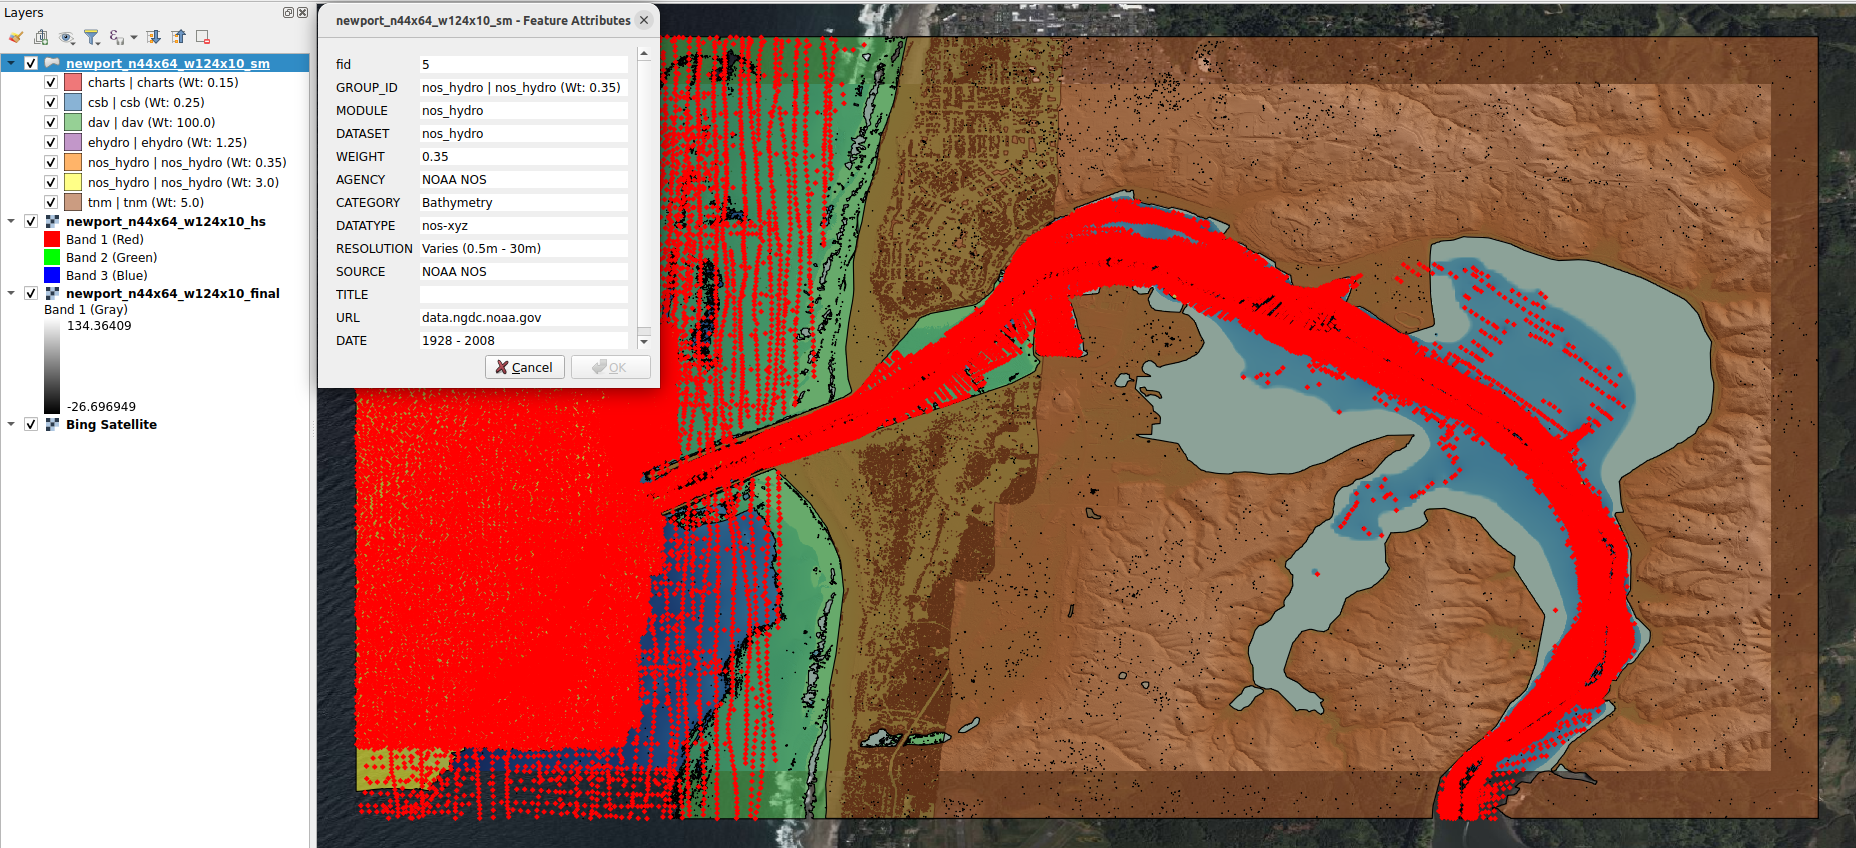
Spatial-metadata attributes. The attribute table provides additional information about the source data supporting each mapped area.
The takeaway
Hillshade:
What does the finished surface look like?

Spatial metadata:
What source data support that surface?
A DEM is more useful when we can understand both the surface and the measurements behind it.
Next: apply the workflow somewhere new
Next:
Module 4 — Same Recipe, New Region
We will move to Sarasota, Florida, change the local pieces of the Newport recipe, and launch a second DEM build.