🛰️ Evaluate the DEMs with IVERT
We have built two coastal DEMs. Now we check them against independent observations using IVERT, the ICESat-2 Validation of Elevations Reporting Tool.
ICESat-2 is a NASA satellite carrying a photon-counting green altimeter lidar called ATLAS. It scans the earth with 6 beams, repeats its orbits every 91 days, fires 10,000 shots a second, and measures individual green photons coming back to the sensor.
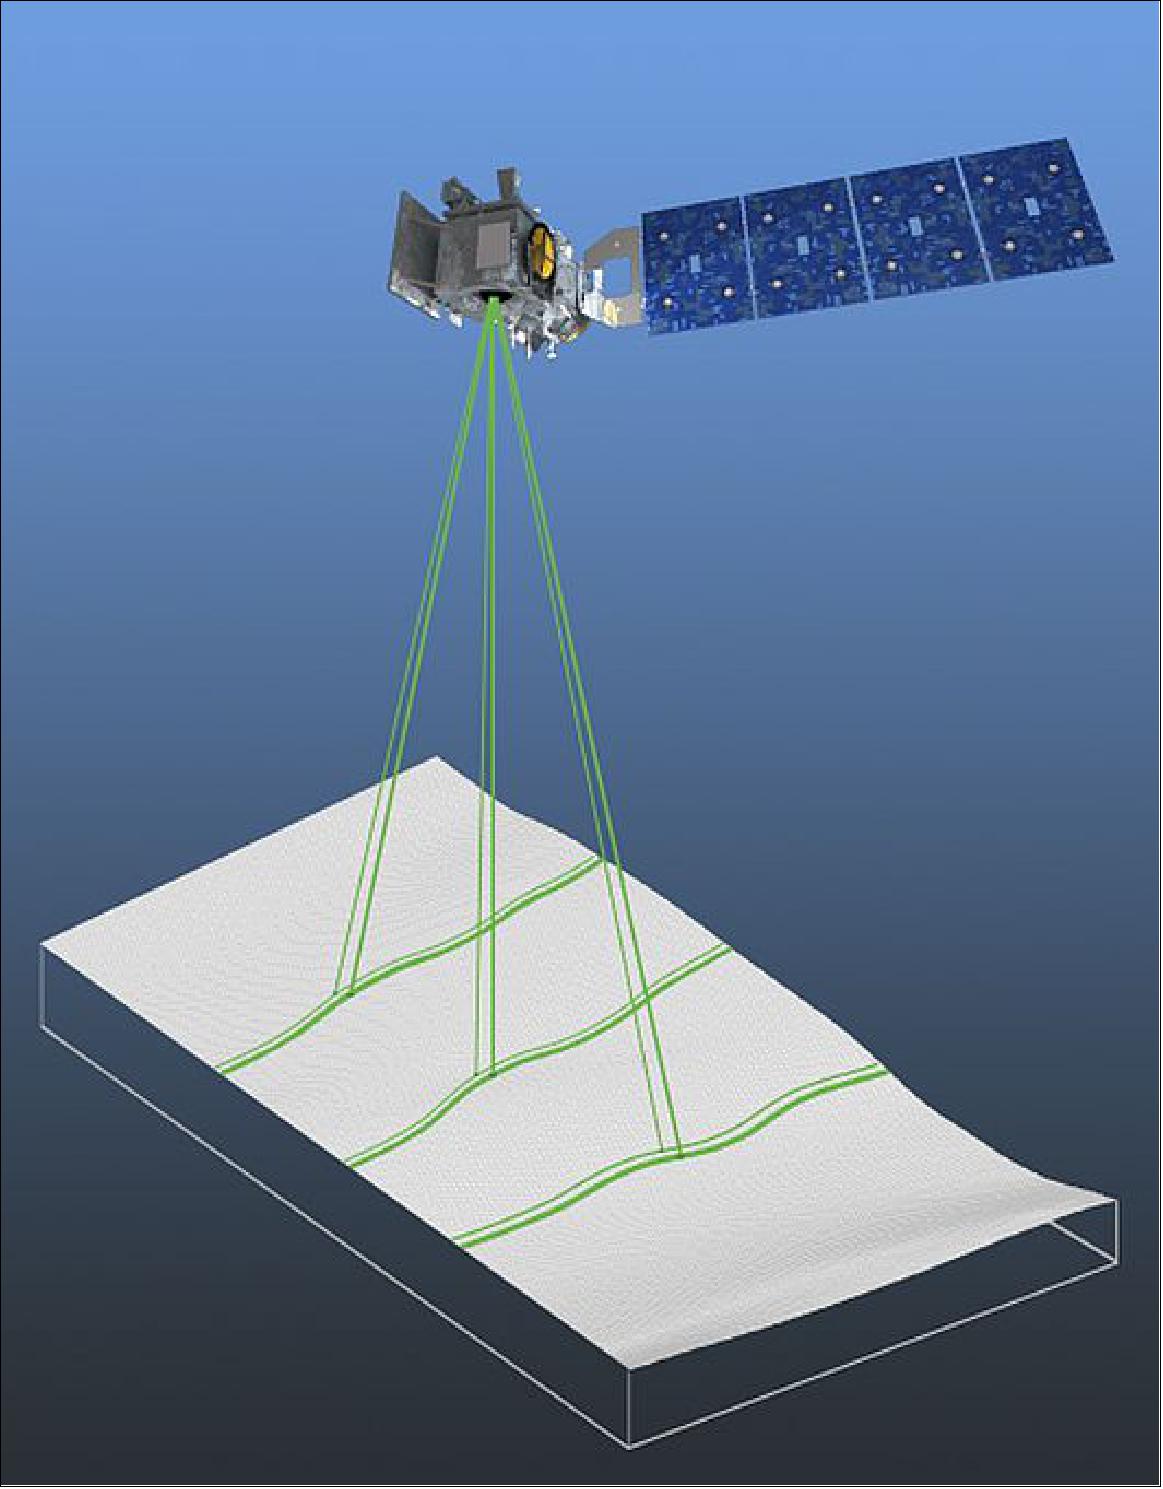
ICESat-2 and its six beams. The ATLAS instrument splits its green laser into three pairs of beams, which trace six parallel ground tracks beneath the satellite. Elevations are measured only along those narrow tracks — not as a continuous grid — which is why IVERT compares a DEM cell-by-cell where tracks happen to cross it. Image credit: NASA Goddard.
IVERT compares a finished DEM against those elevations and produces statistical and spatial views of the comparison: an independent end-to-end check on the result of your DEM workflow.
Why not just inspect the hillshade?
Visual inspection is extremely useful for finding obvious artifacts, discontinuities, or unrealistic terrain. But a DEM can look reasonable and still contain vertical bias or other elevation artifacts.
IVERT adds an independent quantitative check that can reveal systematic vertical bias, the magnitude and spread of elevation differences, persistent outliers, and spatial patterns in those differences. Those patterns can point back toward source data or processing areas that deserve a closer look.
IVERT does not test every processing step. It asks whether the combined result agrees with independent observations where those observations exist.
Launch a new terminal so we can run IVERT while the Sarasota DEM continues building:
File → New → Terminal🔧 1. Point IVERT at the workshop database
A database of ICESat-2 granules has already been prepared and staged in ~/workshop/ivert, so we point IVERT at it instead of its default location:
ivert options ivert_database_directory=~/workshop/ivert/granules cache_directory=~/workshop/ivert/cache --yes| Option | Meaning |
|---|---|
ivert_database_directory=... | Where IVERT reads validation granules from |
cache_directory=... | Where the pre-built conversion grids live |
--yes | Accept the changes without an interactive confirmation |
Now see what is in it:
ivert database listYou should see roughly 41 granules — subsetted ATL03 granules with classified photons, spanning 2020 through 2024, covering the Newport and Sarasota regions we built DEMs for today.
Why is the database prepared in advance?
At home you would build this database from NASA ICESat-2 data before validating anything, which takes 20 minutes for a small region and over an hour for a large one. We skip that here for time. To do it yourself later, see Building your own IVERT database.
🔧 2. Evaluate Newport
Go to your Newport DEM
cd ~/workshop/newport_demDon’t have a Newport DEM?
mkdir -p ~/workshop/newport_dem && cp ~/workshop/ivert/example_dems/newport_n44x64_w124x10_final.tif ~/workshop/newport_dem && cd ~/workshop/newport_demRun the Newport validation
ivert validate *_final.tif -n "Newport, OR"| Option | Meaning |
|---|---|
*_final.tif | DEM(s) to evaluate. Matches any file in this folder ending in _final.tif; multiple DEMs can be validated at once. |
-n "Newport, OR" | Title for the DEM. Appears on the plot. |
Five files are written to an ivert_results sub-directory:
| File | Contents |
|---|---|
..._results.h5 | Cell-level results database. Every other output is a view of this file. |
..._plot.png | Error histogram and 1:1 plot, with total RMSE. |
..._errors.gpkg | Cell-level errors as GIS points. |
..._errors.tif | The same errors as a sparse GeoTiff. |
..._summary_stats.txt | High-level validation statistics. |
⚠️ Watch your vertical datum
Today’s DEMs declare their vertical datum in the header, so IVERT handles it for us. DEMs that don’t can be matched to the wrong datum, producing offsets of meters or even dozens of meters. A large, suspiciously uniform bias is usually a datum problem, not a DEM problem.
State it explicitly if you are unsure:
ivert validate *_final.tif -n "Newport, OR" --vdatum navd88Accepts an EPSG code (5703) or a short name (navd88, egm2008, mllw). Run ivert validate --list-vdatums for the full list.
Look at the Newport results
In the JupyterLab file browser, open the ivert_results directory and look at:
newport_n44x64_w124x10_final_plot.png— press-to zoom out if it opens too largenewport_n44x64_w124x10_summary_stats.txt
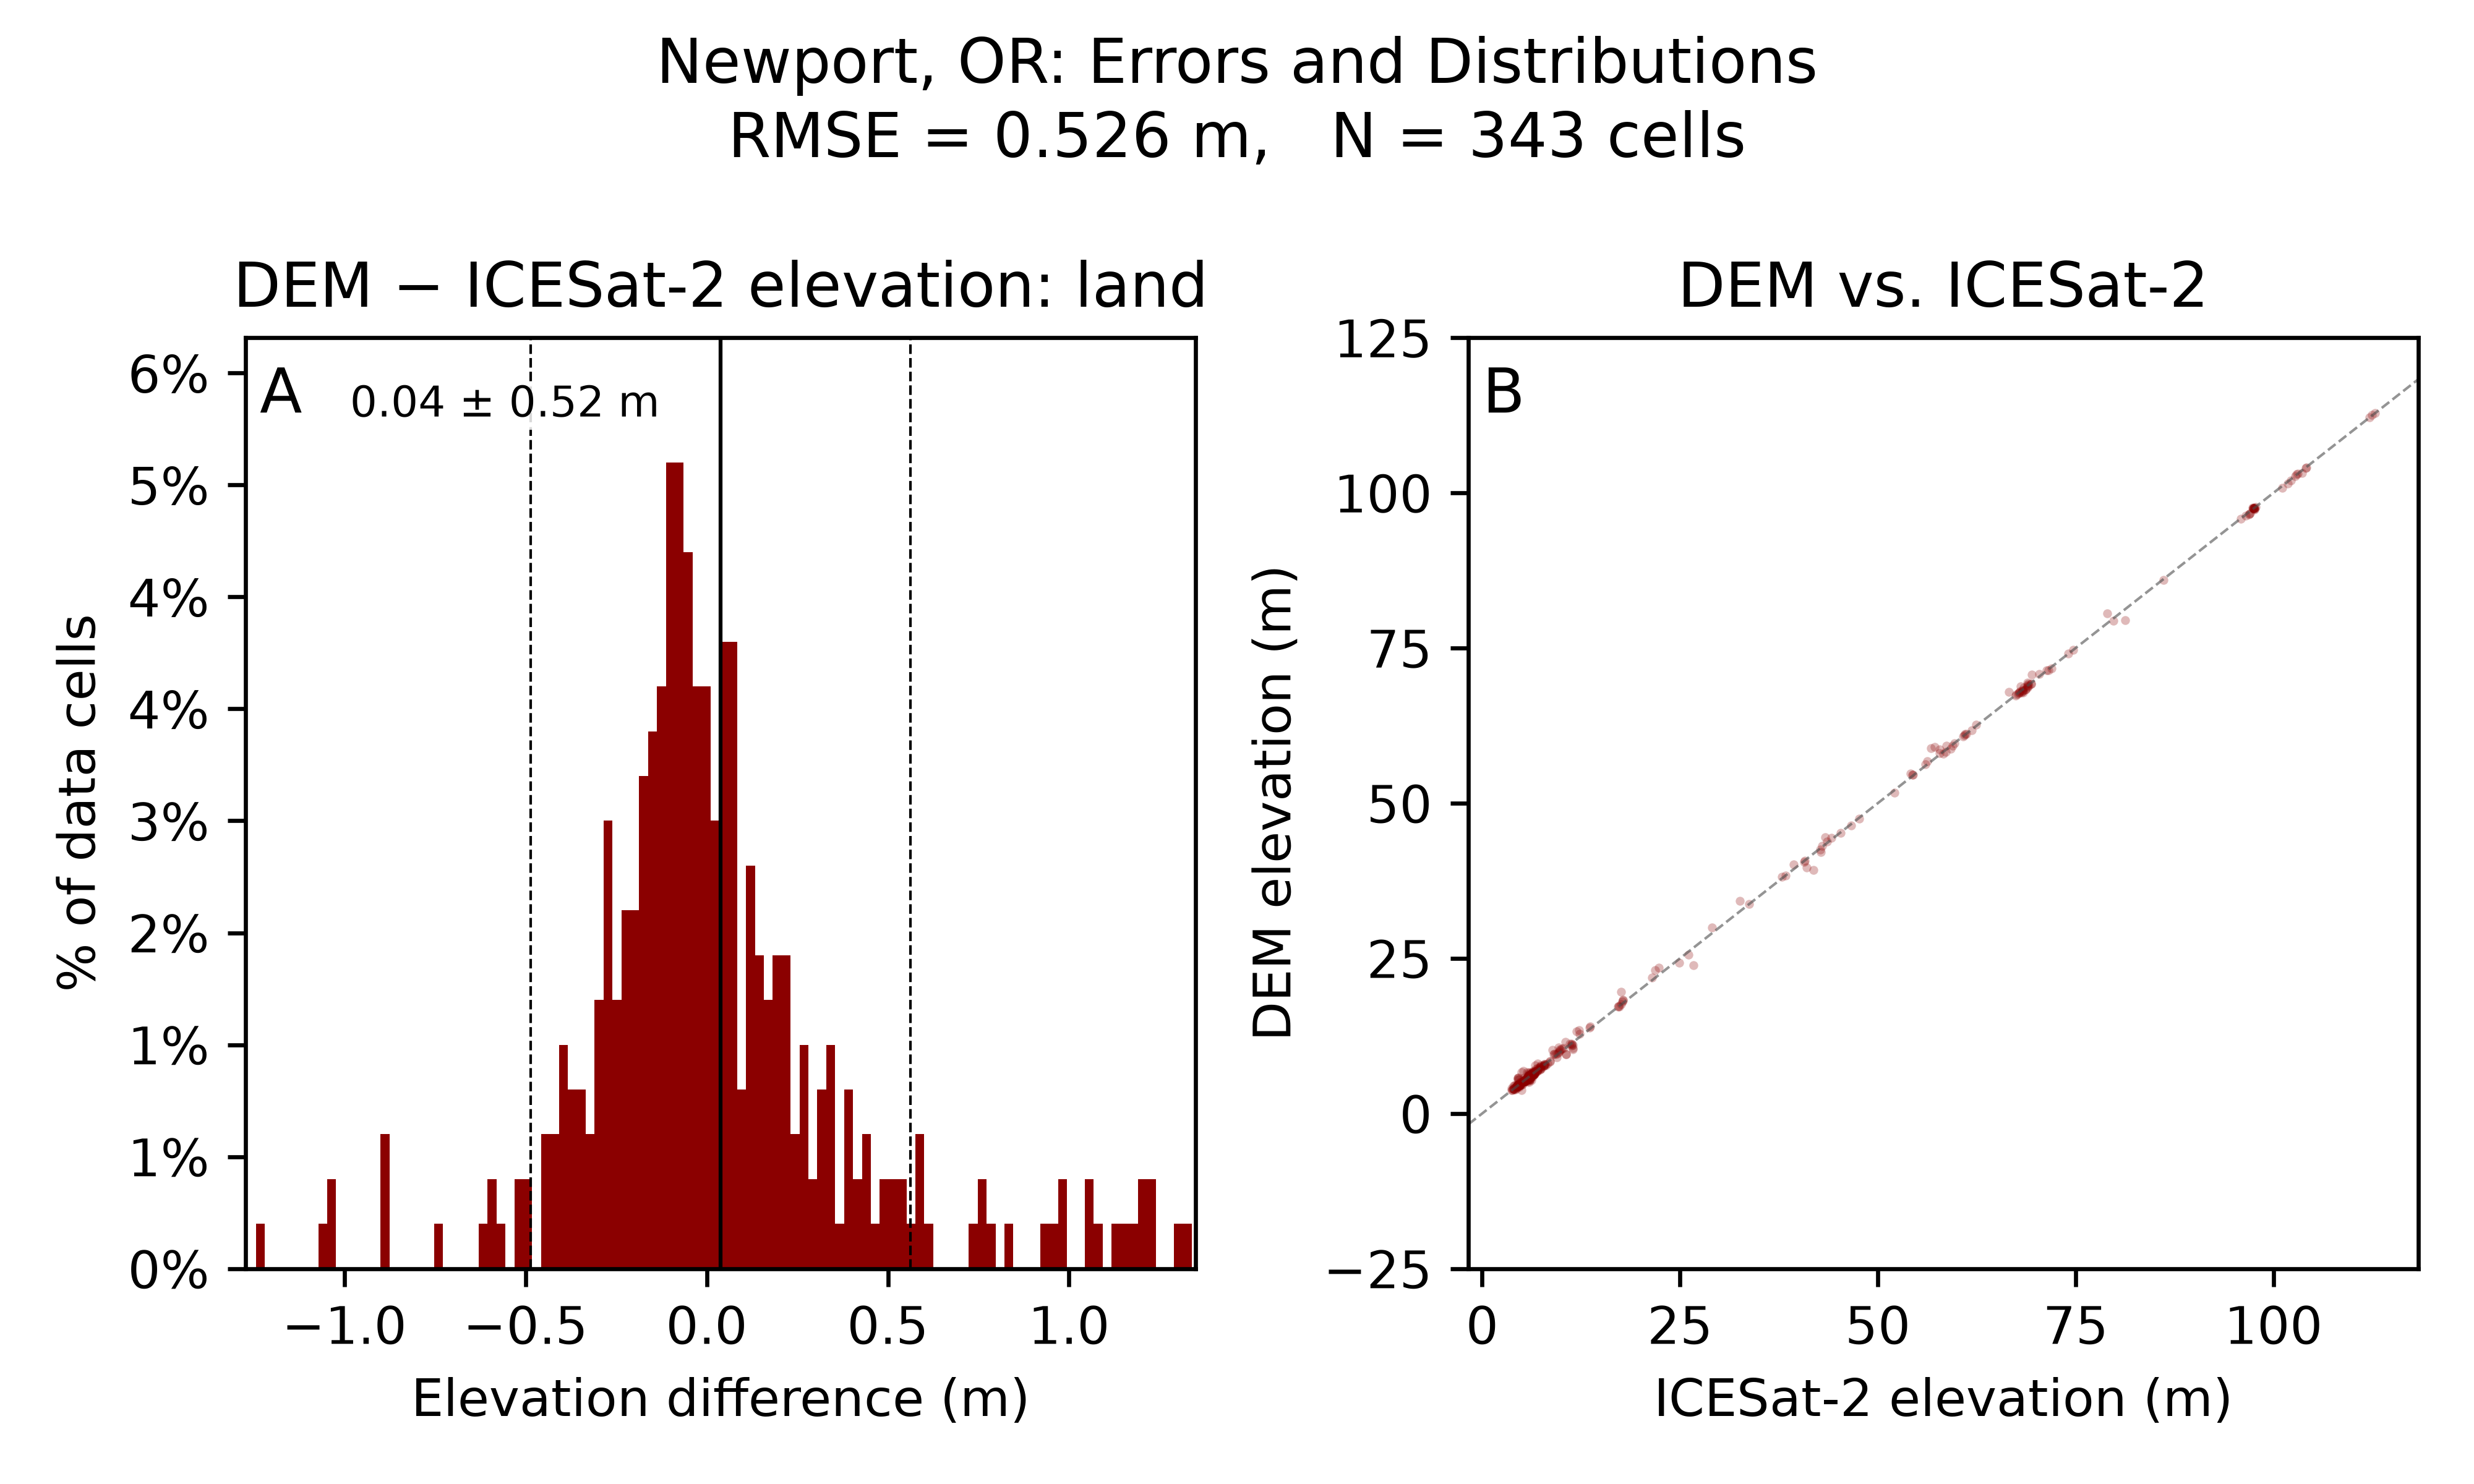
Newport, Oregon IVERT results. Panel A is the distribution of land elevation differences (0.04 ± 0.52 m); panel B compares DEM and ICESat-2 elevations directly. Overall RMSE is 0.526 m across 343 cells.
Ask: Is the DEM systematically high or low? Is the error distribution a clean bell curve, or bimodal? How large is the spread, and are there long tails?
Optional: view the errors in a GIS
Download newport_n44x64_w124x10_final_errors.gpkg, load it over your Newport hillshade in QGIS or Arc, and set a “Graduated” display on the error field. You can also click any point to inspect its values.
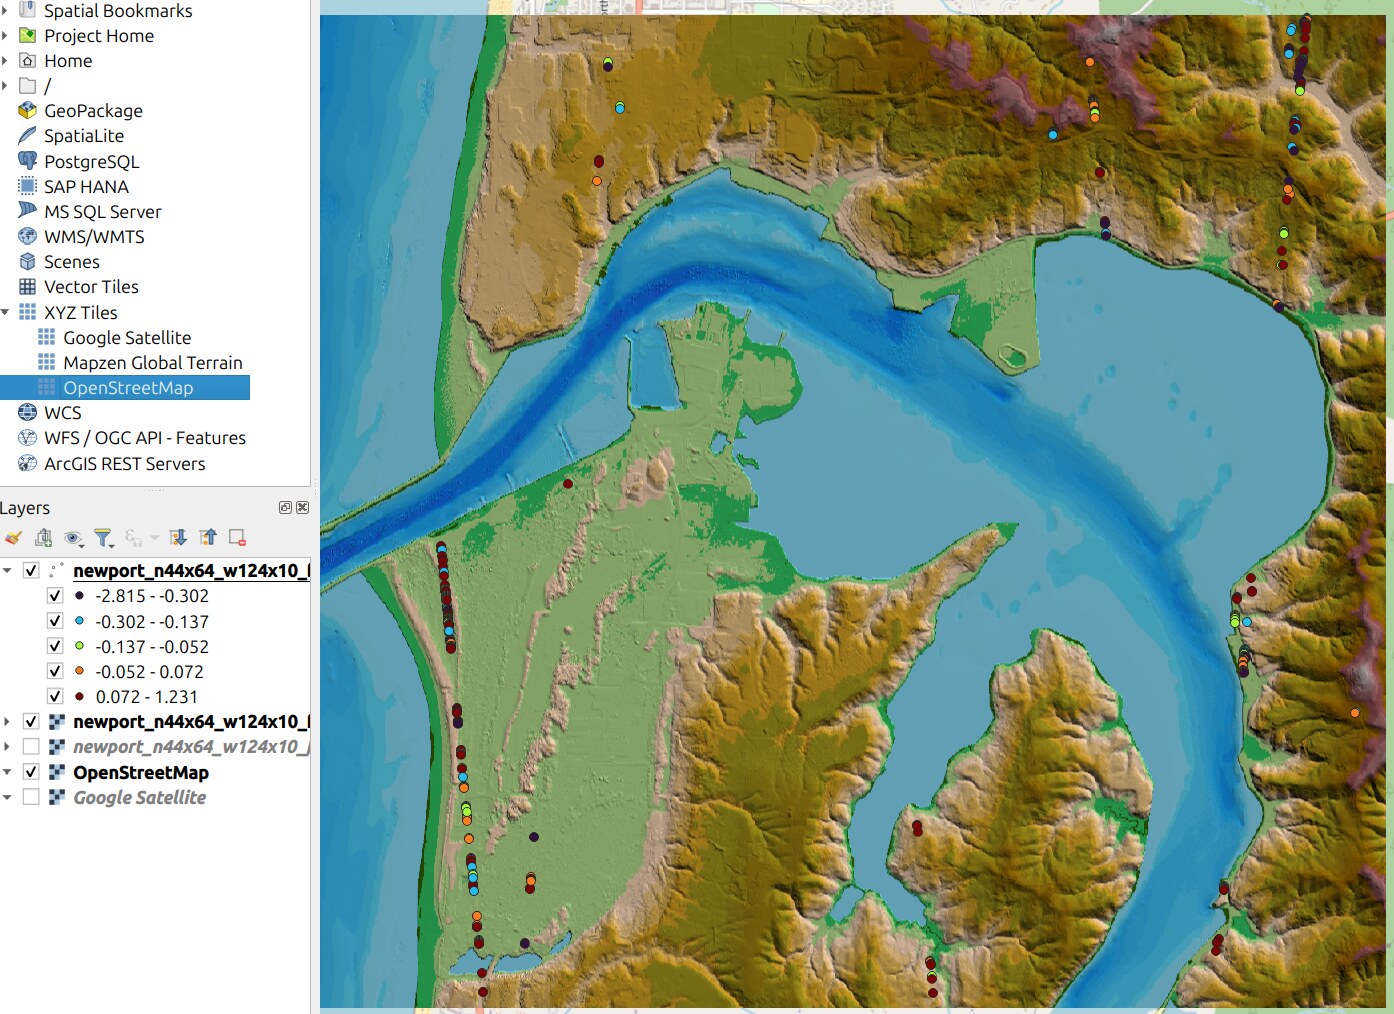
Newport errors in QGIS. Validation points over the Newport hillshade, graduated on the error field.
Compare the error locations against the spatial metadata from Module 3 to see which source data support the DEM where the errors are.
🔧 3. Evaluate Sarasota
Check the terminal where the Sarasota build has been running:
ls -lh ~/workshop/sarasota_dem/*_final.tifIf you see a _final.tif file, the DEM is ready. If the build is still going, use the backup below rather than waiting.
Go to your Sarasota DEM
cd ~/workshop/sarasota_demDon’t have a Sarasota DEM?
This copies the backup into a separate directory so it does not collide with a build still running:
mkdir -p ~/workshop/sarasota_dem_sample && cp ~/workshop/ivert/example_dems/sarasota_n27x34_w082x59_final.tif ~/workshop/sarasota_dem_sample && cd ~/workshop/sarasota_dem_sampleRun the Sarasota validation
From ~/workshop/sarasota_dem or ~/workshop/sarasota_dem_sample:
ivert validate *_final.tif -n "Sarasota, FL"Then open, as before:
ivert_results/sarasota_n27x34_w082x59_final_plot.png
ivert_results/sarasota_n27x34_w082x59_summary_stats.txt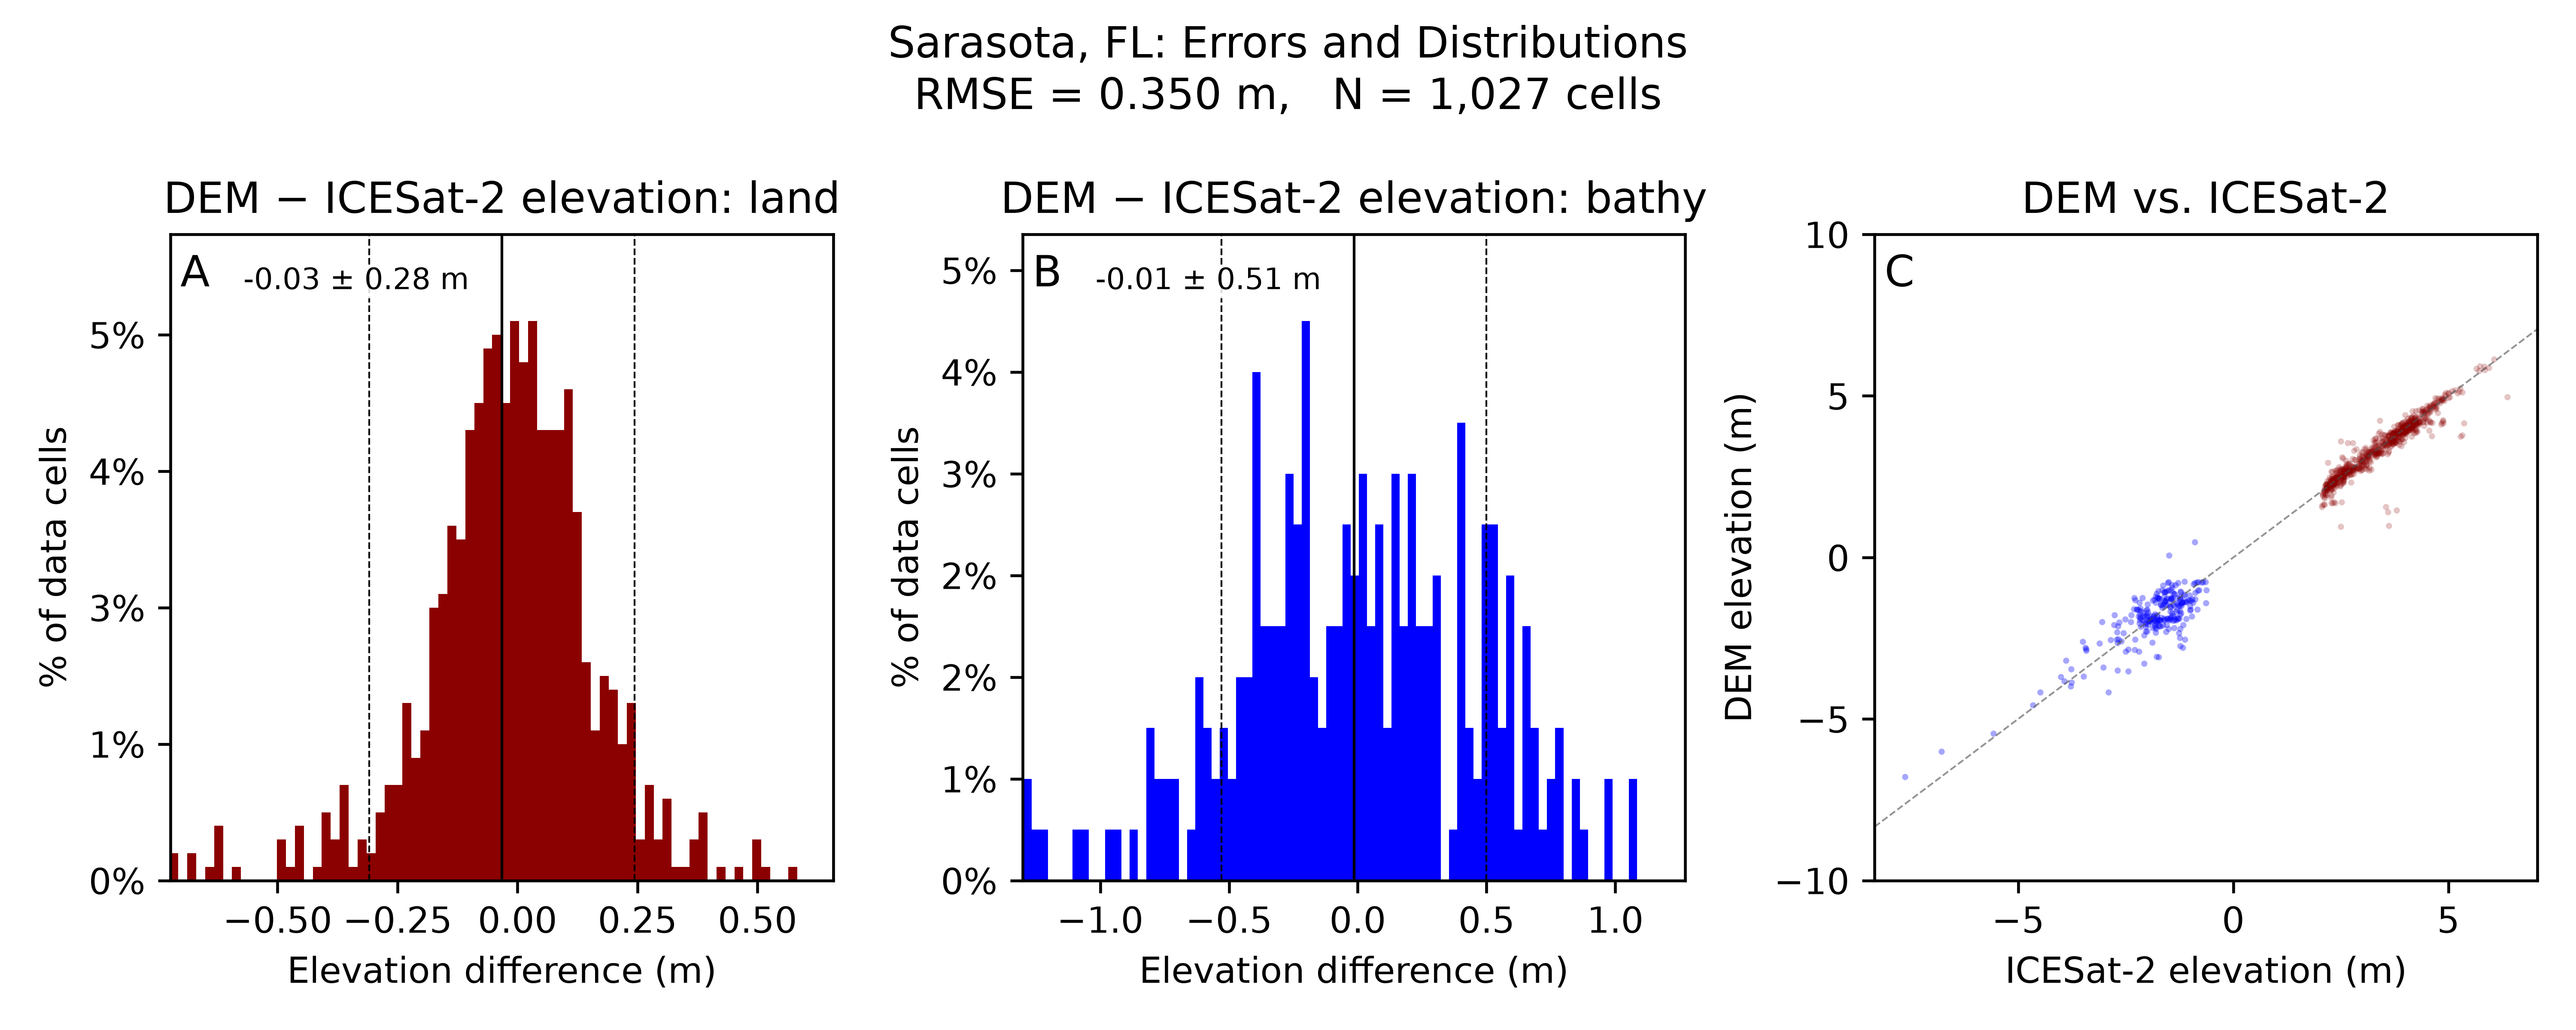
Sarasota, Florida IVERT results. Panel A is the land elevation differences (-0.03 ± 0.28 m), panel B the bathymetric differences (-0.01 ± 0.51 m), and panel C compares DEM and ICESat-2 elevations across both. Overall RMSE is 0.350 m across 1,027 cells. Note the separate bathymetric distribution — the terrestrial and submerged parts of the DEM are evaluated independently.
Sarasota has more shallow, non-turbid water than Newport, so ICESat-2 surveyed some of the seafloor here. That gives us an independent check on the submerged part of the DEM as well as the land — ask the same questions as for Newport, plus what the bathymetric panel says about elevations below the water surface.
Optional: view the Sarasota errors in a GIS
Download sarasota_n27x34_w082x59_final_errors.gpkg and load it over the Sarasota hillshade with a “Graduated” display on the error field.
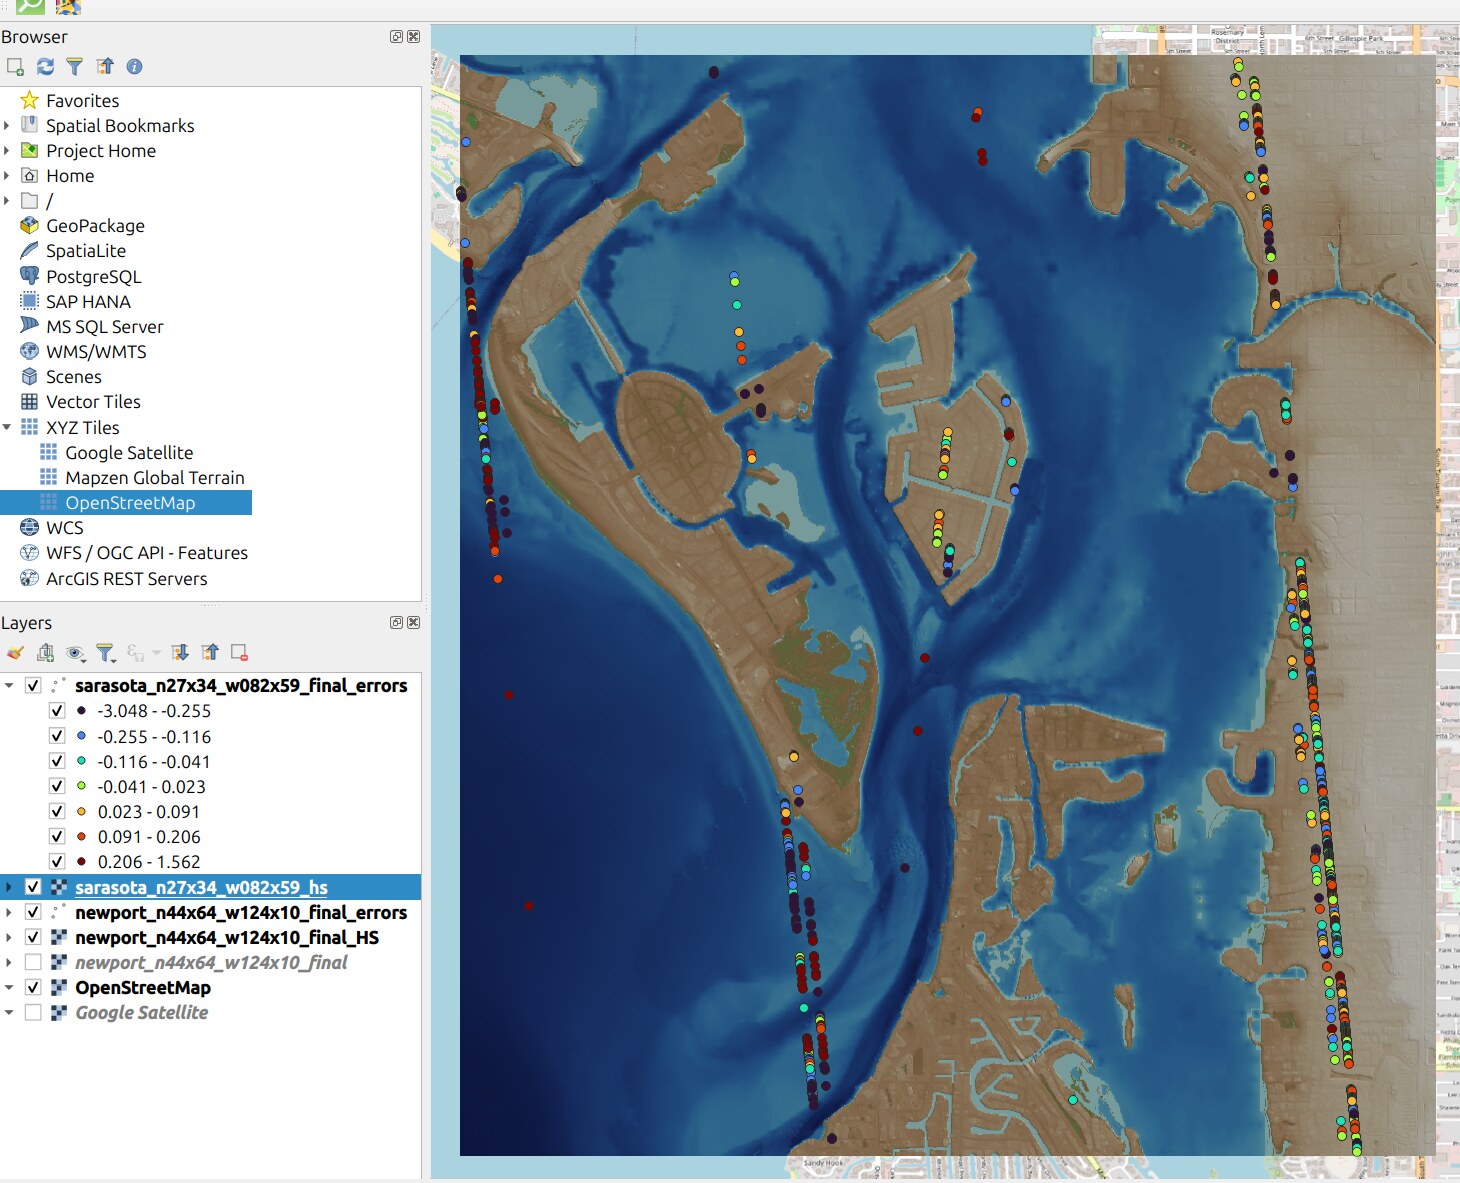
Sarasota errors in QGIS. Unlike Newport, many of these points fall over water, where ICESat-2 sampled the shallow seafloor — those cells are checking the bathymetric portion of the DEM.
Interpreting IVERT results responsibly
IVERT gives an independent check on the result of the entire workflow, but to read it well, consider:
where the independent observations are located
what part of the DEM they sample
whether they are independent of the DEM inputs — don’t validate with ICESat-2 if you used ICESat-2 in the DEM itself. Avoid circular logic!
how the observed differences relate back to the DEM’s source data and processing
Extensions
EXTRA: Try your own study area
For another U.S. coastal region: define your bounds, start with coupling-bathy-topo, search NOAA Digital Coast DAV for useful local lidar, add datasets that improve the recipe, build the DEM, inspect the surface and its spatial metadata, then evaluate it with IVERT.
That is the same workflow we used for Newport and Sarasota.
EXTRA: Build your own IVERT database
IVERT can also build a database of classified ICESat-2 photons for your own validations. It takes 20 minutes at minimum and over an hour for larger queries, so try it after the workshop: Building your own IVERT database.
Before you leave
There are a few final steps to take before logging off your virtual machine. Please read 6 - Wrap it up before closing your browser.