Day 2 builds on the Fiji test DEM and YAML walkthrough from Day 1. Now that participants have seen how a complete DEM recipe is structured, the goal is to step through the main workflow tools more directly and then run a custom region using globato.
By the end of Day 2, participants should understand how fetchez, transformez, globato, and IVERT fit together in a reproducible coastal DEM workflow. Participants should be able to discover source data, understand vertical transformation needs, run or modify a recipe, inspect generated DEM outputs, and consider basic validation and quality-control questions.
Learning Goals
By the end of this section, participants should be able to:
Reactivate the
cudemenvironmentConfirm that the main CUDEM tools are still working
Understand the role of
fetchezin data discovery and source-data accessUnderstand the role of
transformezin vertical harmonizationUnderstand how
globatoconnects the CUDEM workflowRun or inspect a custom DEM recipe with
globatoUnderstand the role of
ivertin independent DEM validationReview DEM outputs and identify basic quality-control issues
Understand how a Fiji-style workflow can be adapted to another coastal region
Reactivate the CUDEM Environment and Update IVERT
Open a Miniforge Prompt or terminal and reactivate the workshop environment:
conda activate cudemBefore we begin today’s tutorials, make sure you are running the latest version of IVERT. With the cudem environment active, update IVERT from conda-forge:
conda update -c conda-forge ivertThen confirm the installed version:
ivert --versionThis should report version 0.6.6. Once it does, you’re ready to continue.
Confirm that the main tools are available:
fetchez --help
transformez --help
globato --help
ivert --help
If these commands return help text, the environment is ready for the Day 2 exercises.
Independent DEM Validation with IVERT
ICESat-2 is a NASA satellite mission, launched in 2018, that measures the elevation of Earth’s surface using a space-based laser altimeter (ATLAS). As it orbits, it collects billions of precisely geolocated elevation measurements (“photons”) across the globe, providing an independent, high-accuracy record of surface heights over land, ice, water, and coastal zones. IVERT (the Icesat-2 Validation of Elevations Reporting Tool) uses these measurements as an independent reference: because ICESat-2 data are collected separately from the source data used to build a DEM, they can be compared against the DEM’s elevations to quantify vertical accuracy and identify errors, biases, and problem areas. This gives us a trustworthy, satellite-derived “ground truth” for validating coastal DEMs anywhere on Earth.
By the end of this session, users should be able to:
Use ICESat-2 data to generate plots and statistics describing the approximate accuracy of their DEMs against satellite-based lidar measurements.
Use those results to pinpoint regions of their DEM where errors may be larger and could use some attention.
Determine where ICESat-2 may be giving erroneous data and mask those areas to improve the accuracy of results.
Download and classify ICESat-2 data in a new region to perform future validations over other areas.
This section covers:
The purpose of independent DEM validation and where it fits in the CUDEM workflow
Required inputs and expected outputs
Running the Fiji test DEM through
ivertFiltering and interpreting the validation results
Setting up custom validations for your own DEMs
Explore IVERT
Start by viewing the commands that ivert provides. Run:
ivert --helpThis lists the available subcommands and options. Take a moment to see what ivert can do before running it.
Set Up IVERT
Next, set up IVERT on your machine:
ivert setupThis creates a .ivert folder in your home directory, where IVERT stores its data. It will also prompt you for whether you want to enter NASA EarthData credentials, which IVERT uses to fetch and subset ICESat-2 data.
For today’s module, you do not need a NASA EarthData account: we will be using pre-downloaded and classified ICESat-2 data over Fiji, so you can skip the credential prompt and continue.
If you would like to run your own validations later and haven’t set up EarthData credentials yet, see the NASA EarthData Credentials section in Module 2.
The IVERT Database
Before IVERT can validate a DEM, it needs a local database of ICESat-2 measurements covering your region of interest. Normally you would build this with the ivert database download command, which fetches fresh ICESat-2 data from NASA’s EarthData repository and classifies it (identifying ground, water, and bathymetry photons) for use as validation points. For a real region, this download and classification step can take 1–2 hours, and longer for a large area.
To keep this tutorial moving, we will instead download and install a pre-compiled IVERT database over our Fiji DEM. This dataset covers all ICESat-2 data collected from November 1, 2022 through November 1, 2024.
We currently cut the data off in early November 2024 because the ATL24 bathymetry product has only been processed through that date, and ATL24 is what lets IVERT classify ICESat-2 bathymetry (below-water) measurements. A new ATL24 processing phase is scheduled for Fall 2026 that will extend ATL24 coverage up to the present; until then, this is the latest date from which we can classify bathymetry data from ICESat-2.
If you would like to build your own database over another region, follow the instructions in the Build an IVERT Database section below, which explains how to download and classify ICESat-2 data yourself.
Install the Pre-Compiled Fiji Database
Download the pre-compiled Fiji database from the workshop’s GitHub release into your IVERT data directory, unzip it in place, and confirm the files landed where IVERT expects them. This places the granules database (icesat2_granules_database.gpkg) and a granules/ folder of classified ICESat-2 photon files directly into your IVERT icesat2 directory. Follow the tab for your operating system:
In your Miniforge Prompt, download the zip, extract it, and list the results. Both curl and tar ship with Windows 10 and 11, so no extra tools are needed:
curl -L -o "%USERPROFILE%\.ivert\icesat2\ivert_granules_fiji.zip" https://github.com/continuous-dems/workshop-gebco-2026/releases/download/ivert-data-v1/ivert_granules_fiji.zip
tar -xf "%USERPROFILE%\.ivert\icesat2\ivert_granules_fiji.zip" -C "%USERPROFILE%\.ivert\icesat2"
dir "%USERPROFILE%\.ivert\icesat2"
dir "%USERPROFILE%\.ivert\icesat2\granules"
The -L flag tells curl to follow GitHub’s redirect to the actual download, and Windows’ tar extracts .zip archives as well as .tar files.
If curl is blocked on your network, paste the download URL from the command above into a web browser instead, then extract the downloaded zip into %USERPROFILE%\.ivert\icesat2\ with File Explorer.
Download the zip, unzip it in place, and list the results:
wget -P ~/.ivert/icesat2 https://github.com/continuous-dems/workshop-gebco-2026/releases/download/ivert-data-v1/ivert_granules_fiji.zip
unzip ~/.ivert/icesat2/ivert_granules_fiji.zip -d ~/.ivert/icesat2
ls ~/.ivert/icesat2
ls ~/.ivert/icesat2/granules
You should see icesat2_granules_database.gpkg alongside a granules/ directory containing the classified .nc granules. IVERT is now ready to validate the Fiji DEM against this pre-loaded ICESat-2 data.
Validate Your DEM
With the Fiji database installed, you’re ready to validate a DEM. First, look at the options ivert validate provides:
ivert validate --helpIn its simplest form, ivert validate takes one or more GeoTIFF DEMs (or a directory or glob of .tif files) and compares each one against the ICESat-2 photons in your database:
ivert validate fiji_test_final.tif -V egm2008 -n "Fiji" -mcA few of the most important options to know:
-V, --vdatum— the vertical datum of your DEM (for exampleegm2008,navd88,mllw, or an EPSG code like3855). This one matters: IVERT has to put the DEM and the ICESat-2 measurements on the same vertical reference before it can compare them. If you leave it off, IVERT reads the datum from the DEM’s metadata header — so pass it explicitly if you’re not sure whether the vertical datum will be read correctly from your DEM’s header data. Runivert validate --list-vdatumsto see all recognized names.-n, --name— a readable region name that appears on the output plots (it defaults to the DEM’s filename).-ex, --exclude— exclude ICESat-2 photons inside a given zone before validating. This is how you mask out areas where ICESat-2 itself is returning bad data (for example over cloud-contaminated or surf-heavy areas). Each use takes either a bounding box in the DEM’s own projection (minx/maxx/miny/maxy, i.e. west/east/south/north — the same ordering theivert databasecommands use) or a vector file (.shp,.geojson,.gpkg) of exclusion polygons, and you can repeat the flag to combine multiple zones.-mc, --measure-coverage— measure how densely ICESat-2 sampled each grid cell (the fraction of sub-regions within a cell that actually contain photons). This is used primarily to account for sampling bias: in a coarse cell, ICESat-2 may only touch a small portion of the ground, so the reported error reflects just that sampled sliver rather than the whole cell. Coverage is typically ignored for higher-resolution (sub-10 m) DEMs, where each cell is small enough that partial sampling matters little. But because we are gridding at 3 arc-seconds (roughly 90 m on the ground), it’s worth measuring here. With coverage measured, IVERT can also report RMSE broken down by coverage decile, and you can drop poorly-sampled cells with-mcp, --minimum-coverage-pct.
When it finishes, IVERT writes its results into an ivert_results/ subdirectory, created relative to the directory where your DEM is stored. (You can send them somewhere else with the -o, --outdir option.) These outputs include summary statistics, plots, and per-cell error layers, which we’ll inspect next.
Explore Your IVERT Results
Open the ivert_results/ subdirectory next to your DEM to see what IVERT produced. Because we validated fiji_test_final.tif, every output here is prefixed with fiji_test_final. Let’s walk through each file in turn.
1. The results database (fiji_test_final_results.h5)
This is an HDF5 database holding the raw, per-grid-cell validation results from IVERT: the elevation difference in each cell, the number of photons used, roughness, and other per-cell measurements. You don’t typically need to open this file directly — but it’s worth knowing that every other output in this directory is derived from it. The summary statistics, the plot, and the error layers are all just different views of the numbers stored here.
2. The summary statistics (fiji_test_final_summary_stats.txt)
This is a plain-text file with some useful statistics describing the validation you just ran. Open it in a text editor and take a look (or look at a sample here). You’ll see values like:
The number of DEM cells validated and the total number of ICESat-2 photons used.
The mean bias error (DEM − ICESat-2), which tells you whether the DEM sits systematically too high or too low relative to ICESat-2.
The RMSE (root-mean-square error), a single-number summary of the DEM’s overall vertical accuracy.
The decile ranges of errors, which are worth scanning for long tails — a few cells with very large errors at the 0th or 100th percentile often point to artifacts in the DEM (or to bad ICESat-2 data) that deserve a closer look.
A breakdown of RMSE by ICESat-2 coverage, showing how the reported accuracy changes if you only trust cells that were sampled by many photons.
3. The plot (fiji_test_final_plot.png)
Open fiji_test_final_plot.png. It should look something like this:
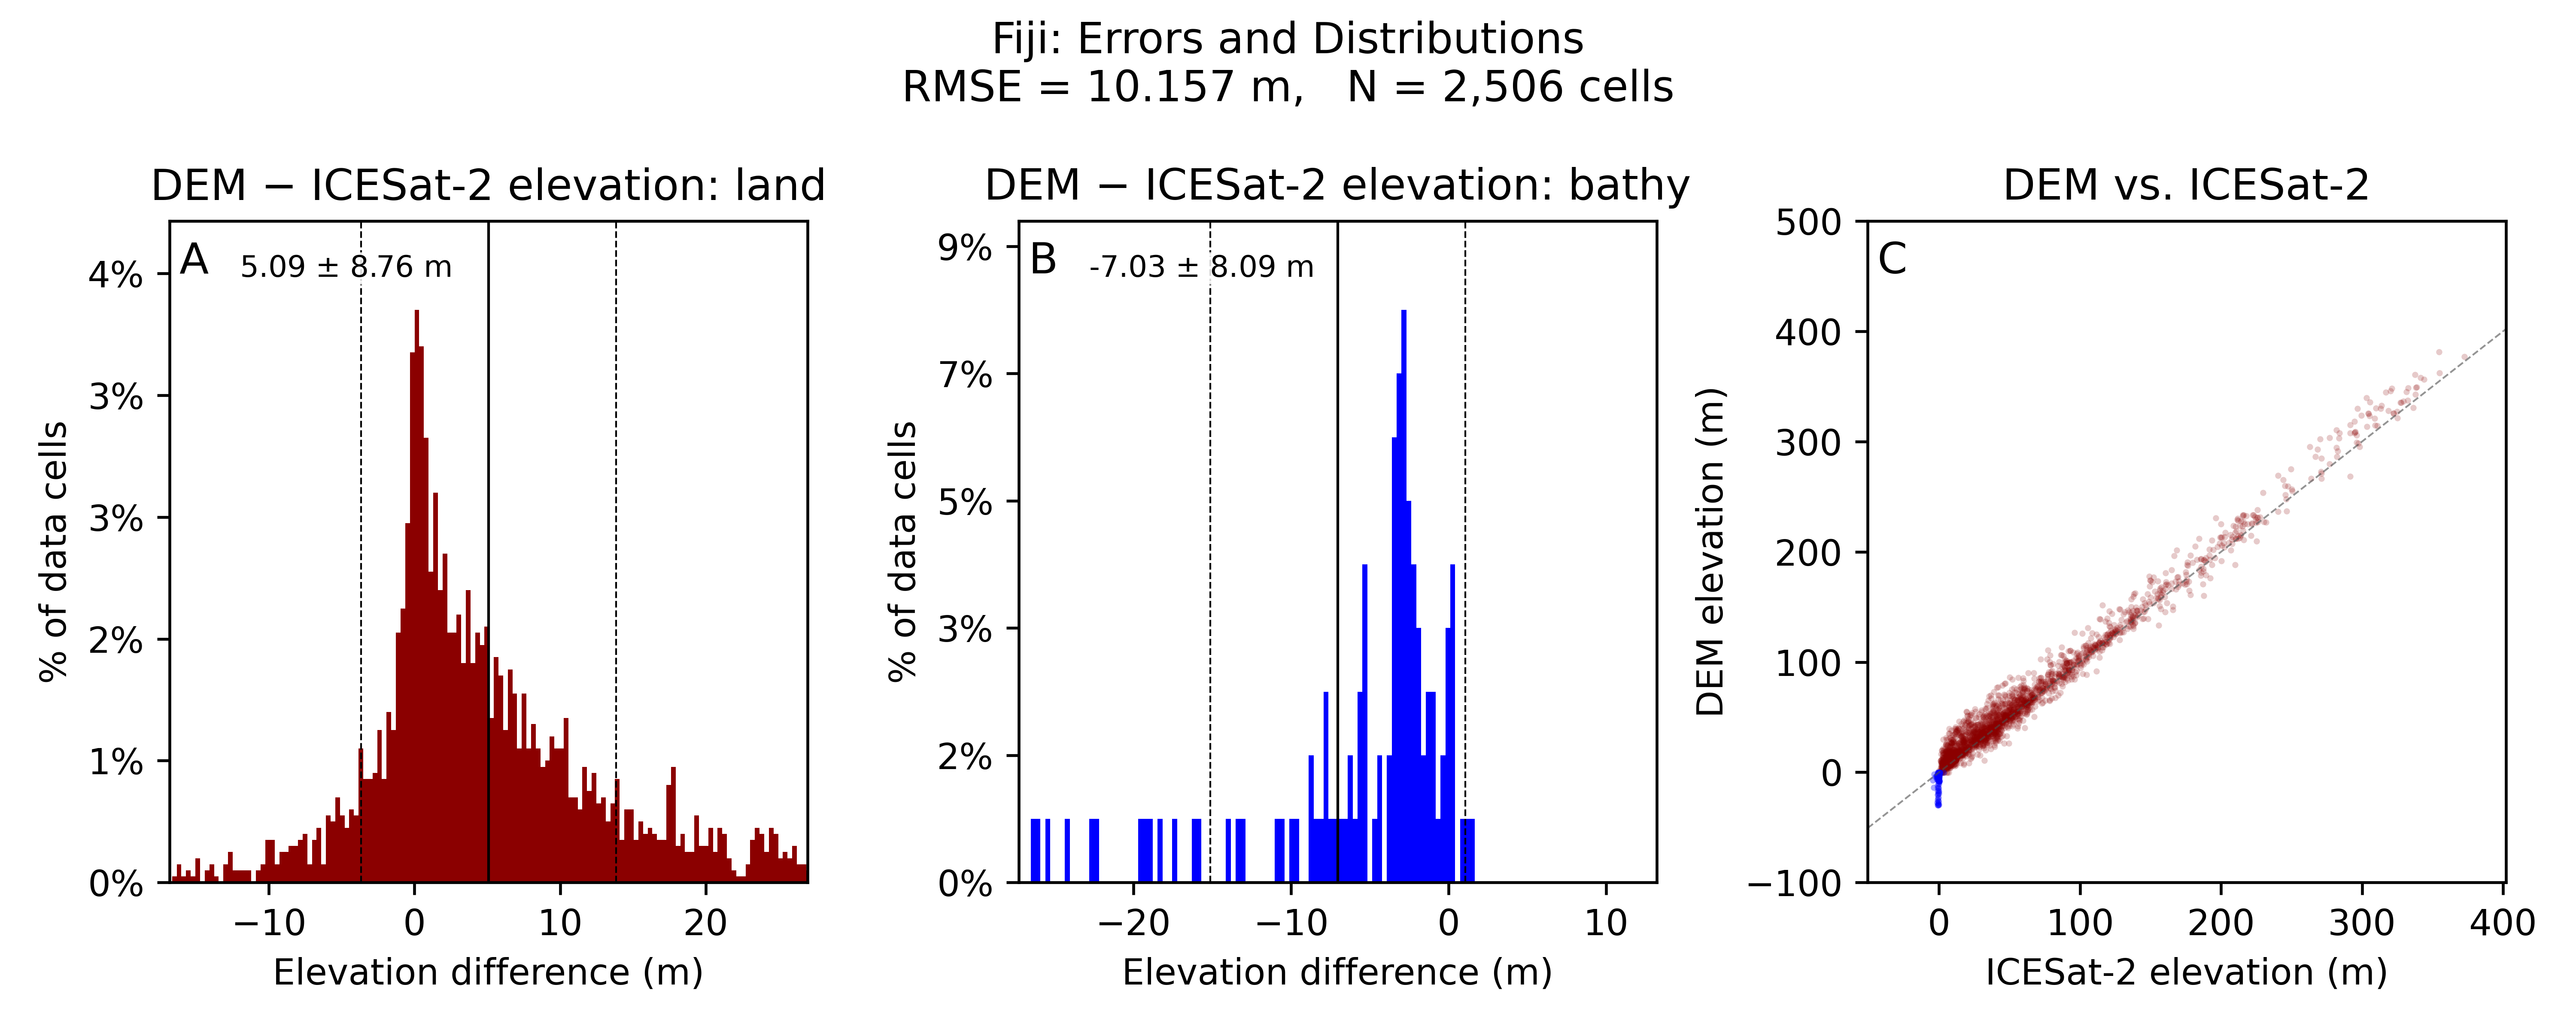
The plot summarizes the validation visually. Panels A and B are histograms of the per-cell elevation differences (DEM − ICESat-2), split into land and bathymetry (below-water) cells, with the mean bias and standard deviation labeled at the top of each. Panel C is a scatter plot of DEM elevation against ICESat-2 elevation: points falling along the dashed 1:1 line indicate good agreement, while systematic departures from that line reveal bias. The title reports the overall RMSE and the number of cells validated.
4. The error layers (fiji_test_final_errors.tif and fiji_test_final_errors.gpkg)
These files are different ways of exporting the same per-cell errors that are summarized in the plot. By default, IVERT saves the errors in two formats:
a sparse raster (
.tif, GeoTIFF), anda vector (
.gpkg, GeoPackage).
Both give the elevation difference (DEM − ICESat-2) in each validated grid cell, so you can map exactly where the DEM agrees well with ICESat-2 and where it doesn’t. If you’d prefer other formats, you can request them with the --export-formats/-ef flag when you run ivert validate.
To explore these results spatially, open a GIS program such as QGIS (free and open-source) or ArcGIS, and load the fiji_test_final_errors.gpkg file. Symbolizing the error field with a diverging color ramp (for example, blue for negative errors and red for positive) makes it easy to spot clusters of large errors and pinpoint the regions of your DEM that may need a closer look, or perhaps in which bad or misclassified ICESat-2 data may have snuck into your validation and should be excluded.
Excluding Data from a Validation
ICESat-2 photon classifications are automated, and like any automated process they can sometimes get it wrong. When you visualize your IVERT results in a GIS, these mistakes often become visible, and you can omit the affected areas and re-run the validation to get a cleaner picture of your DEM’s true accuracy.
A somewhat-common case is when near-surface photons in deep water are mistakenly classed as bathy_floor (seafloor) returns — even where the ocean is hundreds of meters deep, far beyond the depth that ICESat-2’s green laser can physically penetrate. Those photons show up as wildly shallow “seafloor” measurements and can badly skew the bathymetry statistics.
When you find such a region, you can manually exclude it from validation using the -ex, --exclude flag, which accepts either a bounding box or a vector file (GeoPackage, shapefile, or GeoJSON) of exclusion polygons. For instance, in the Fiji DEM some photons near a reef were flagged as far too shallow within the bounding box 178.641/178.647/-18.15/-18.133. To re-run the validation with that zone excluded, pass the box to -ex in minx/maxx/miny/maxy (west/east/south/north) order — the same ordering the ivert database commands use:
ivert validate fiji_test_final.tif -V egm2008 -n "Fiji" -mc -ex 178.641/178.647/-18.15/-18.133You can repeat -ex to combine multiple zones in a single run. Typically, though, you’d want to save your exclusion zones in a vector file (for example fiji_exclusions.gpkg) and pass that file to -ex instead, so the exclusions are documented and reproducible for later provenance:
ivert validate fiji_test_final.tif -V egm2008 -n "Fiji" -mc -ex fiji_exclusions.gpkg(Optional) Build an IVERT Database
This section is for anyone who wants to run validations over their own region after the workshop, rather than using the pre-compiled Fiji data. Building your own database means downloading and classifying ICESat-2 data yourself, which requires a NASA EarthData account (see the NASA EarthData Credentials section in Module 2).
First, view the database subcommands:
ivert database --helpYou’ll see the subcommands for managing your local ICESat-2 photon database, including download, list, size, rebuild, and delete.
Next, look at the options for downloading new data:
ivert database download --helpThe main thing to specify is your region of interest, which you can give in one of two ways: by pointing at the DEM(s) you plan to validate, or by listing a bounding box directly.
Option 1 — download by DEM extent. Pass one or more DEM files, and IVERT downloads ICESat-2 data covering their combined extent:
ivert database download -ds 2023.01.01 -de 2024.01.01 ../dems/my_region_dem.tifYou can pass multiple files (for example ../dems/*.tif) to cover a whole tile set at once.
Option 2 — download by bounding box. Alternately, list the coordinates of the area you’d like to download, in W/E/S/N order (west/east/south/north). Because the coordinates can start with a negative sign, add -- to mark the end of the options first:
ivert database download -ds 2023.01.01 -de 2024.01.01 -- 178.25/178.65/-18.30/-17.95This example covers the Fiji test region. Add the --wsen flag if you’d rather give the box in W/S/E/N (lower-left, upper-right) order.
The -ds and -de flags set the start and end dates of the ICESat-2 search; they accept flexible formats like 2023.01.01 or "one year ago". IVERT then fetches the matching granules from NASA EarthData and classifies them into ground, water, and bathymetry photons — the same download-and-classification step that can take 1–2 hours for a sizable region. If your date range extends past the ATL24 bathymetry cutoff, IVERT will warn you before continuing. When it finishes, your new granules and database index are stored in ~/.ivert/icesat2/, ready to validate DEMs over that region.